The 5 most in-demand federal campgrounds near Grand Canyon National Park
Mather took about 177.1 reservations per site each year, the most of the 5 campgrounds we ranked. Half its campers booked ~5 weeks or more ahead, and its sites were an estimated 88% full in summer.
Ranked by reservations per reservable site per year (FY2023–2025), so a small campground that fills up counts as much as a big one. "Typical booking" is when half of campers had already reserved; summer occupancy is our estimate (see how we measured).
01 · South Rim
Mather Campground
Ponderosa shade a mile from the rim
Opening day working hard to clear roads. Campsites snowy with 2 to 4 feet of snow.Photo: NPS Photo by Diego Ferron / Recreation.gov
Under ponderosa pine, pinyon and juniper on the South Rim, with most sites shaded and the canyon edge one mile away.
Half of May Friday and Saturday arrivals were reserved at least 76 days ahead, and a quarter at least 133 days ahead.
~5 weeks out typical booking~88% full in summer (est.)177.1 reservations per site / yrRanked 1st of 5 · 281 reservable sites · 142,654 reservations FY2023–2025
At 7,463 feet, 23 miles east of Grand Canyon Village, under pinyon and juniper less than half a mile from the rim.
Half of May Friday and Saturday arrivals were reserved at least 62 days ahead, and a quarter at least 105 days ahead.
~6 weeks out typical booking~82% full in summer (est.)127.9 reservations per site / yrRanked 2nd of 5 · 49 reservable sites · 17,455 reservations FY2023–2025
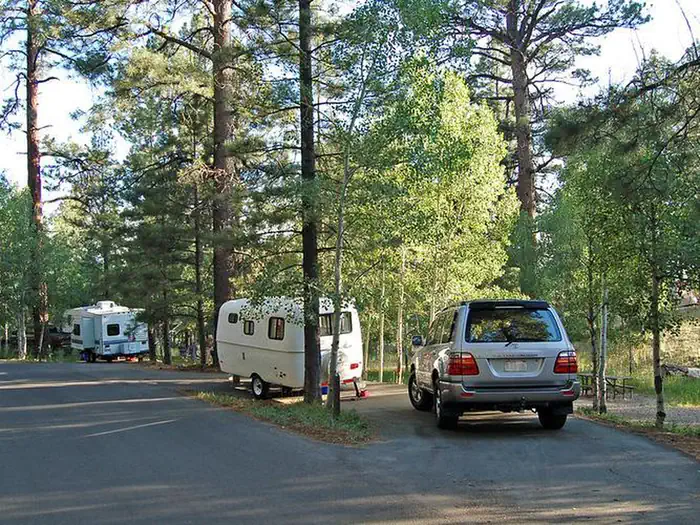
Small trailers parked at campsites in the North Rim Campground.Photo: NPS/GRCA / Recreation.gov
Above 8,000 feet in ponderosa pine and aspen on the remote North Rim, about 210 miles by road from Grand Canyon Village.
Half of June Friday and Saturday arrivals were reserved at least 145 days ahead, and a quarter at least 174 days ahead.
The earliest-booking campground here: half of June weekend arrivals were reserved at least 145 days ahead, nearly five months.
~4 months out typical booking~98% full in summer (est.)113.2 reservations per site / yrRanked 3rd of 5 · 84 reservable sites · 24,652 reservations FY2023–2025
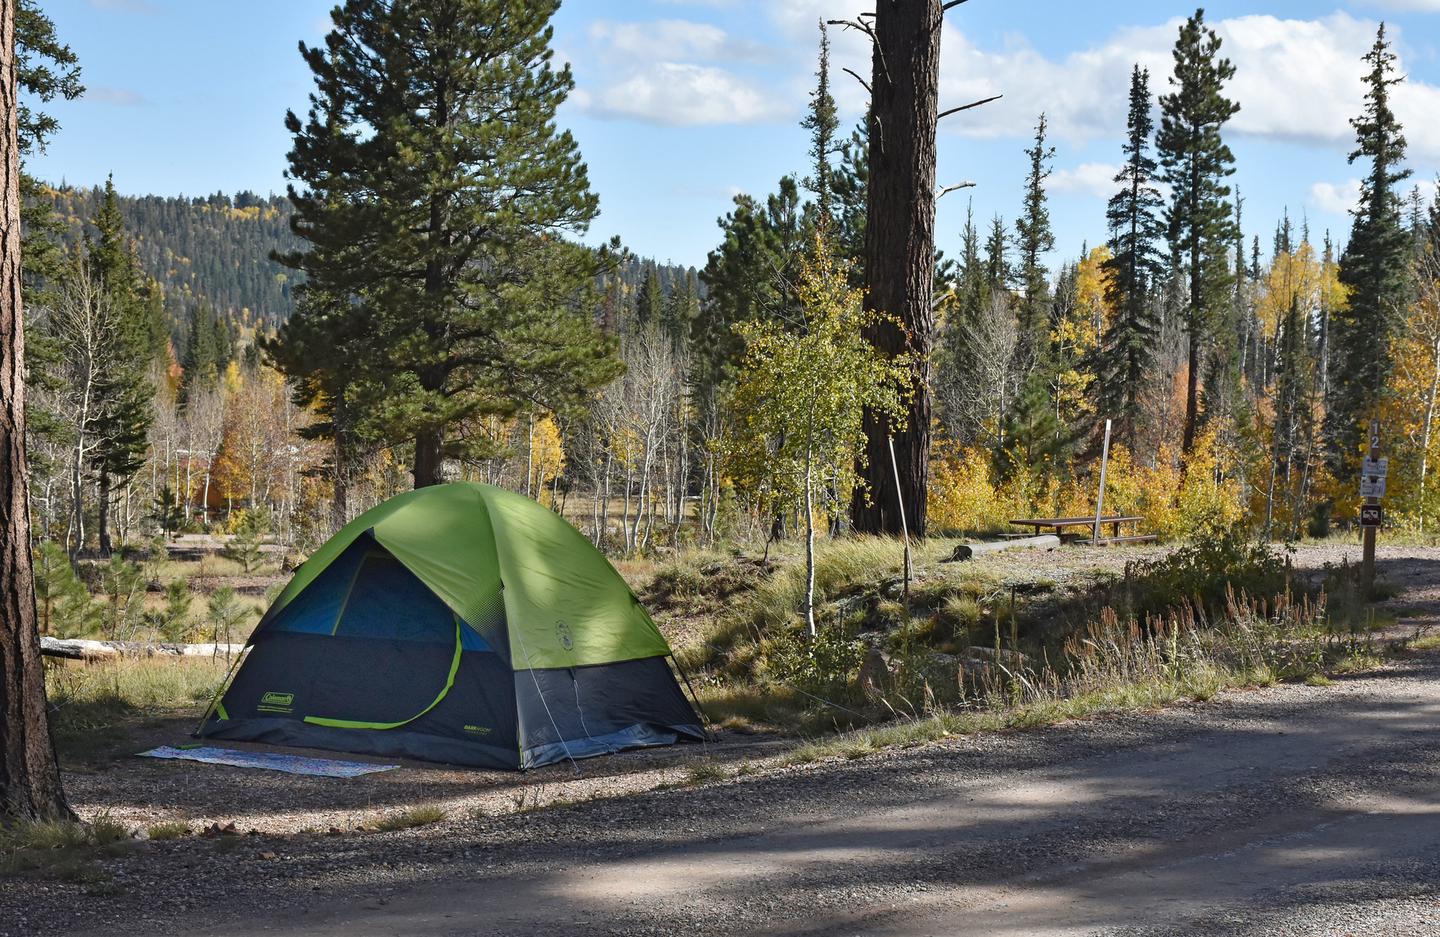
DeMotte Campground campsite with tent.Photo: USFS Staff / Recreation.gov
In the North Kaibab Ranger District on Arizona Highway 67, seven miles north of the North Rim entrance.
Half of June Friday and Saturday arrivals were reserved at least 59 days ahead, and a quarter at least 110 days ahead.
~2 months out typical booking~56% full in summer (est.)53.2 reservations per site / yrRanked 4th of 5 · 38 reservable sites · 5,576 reservations FY2023–2025
Ponderosa pine 4 miles from the South Rim entrance
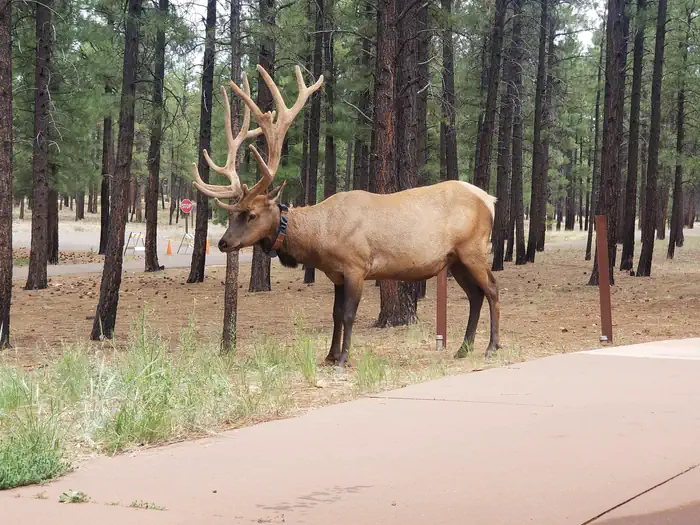
A bull elk with large antlers standing next to a sidewalk with trees behind it.Photo: Forest Service photo by Z. Rice / Recreation.gov
In Kaibab National Forest ponderosa pine and Gambel oak at 6,600 feet, just 4 miles south of the park entrance.
Half of May Friday and Saturday arrivals were reserved at least 31 days ahead, and a quarter at least 54 days ahead.
Books closer to the date: half of May weekend arrivals were reserved at least 31 days ahead, the shortest lead of the five.
~3 weeks out typical booking~15% full in summer (est.)13.8 reservations per site / yrRanked 5th of 5 · 158 reservable sites · 6,569 reservations FY2023–2025
All 5 campgrounds, ranked by reservations per site
Typical booking: median days between booking and arrival, FY2023–2025. Peak season, est. full: reserved site-nights ÷ (reservable sites × nights) in summer (June–August), 2023–2025; blank where we couldn't estimate it reliably. Ranking is reservations per reservable site per year, averaged over the FY2023–2025 years each campground took reservations (campgrounds that joined Recreation.gov recently are marked "Partial history"). Details in About this data.
Reservations peaked at about 75,000 in FY2024 and were about 66,000 in FY2025, about where they were before 2020 (67,000 a year).
67,055 a year on average in FY2015–2019, 66,297 in FY2025, across all 5 campgrounds we studied. FY2020–21 were shaped by COVID closures and the camping surge.
FY15
FY16
FY17
FY18
FY19
41,464FY20COVID
66,375FY21COVID
FY22
FY23
FY24
66,297FY25
The set of campgrounds on Recreation.gov changed over these years (some, like Desert View, joined recently), so part of the change reflects which campgrounds were bookable there, not only how many people camped.
All values
FY2015: 65,201
FY2016: 67,094
FY2017: 68,875
FY2018: 70,647
FY2019: 63,460
FY2020: 41,464 (COVID year)
FY2021: 66,375 (COVID year)
FY2022: 74,024
FY2023: 74,625
FY2024: 75,266
FY2025: 66,297
Find a Grand Canyon campsite for your dates
Compare current openings and prices around Grand Canyon National Park.
Data: Recreation.gov reservations FY2015–2025. These are Recreation.gov's public reservation records (the RIDB historical reservation files), covering every federal campground in the area that took at least 300 reservations in FY2023–2025. Federal fiscal years run October to September, so FY2025 is October 2024 through September 2025.
Which campgrounds are included. Every federal campground inside Grand Canyon National Park or within 30 miles of its center point (straight-line distance) that takes reservations on Recreation.gov. Area / setting comes from each campground's Recreation.gov coordinates and managing agency; nearby towns are straight-line.
How we ranked. By reservations per reservable site per year: a campground's FY2023–2025 reservations divided by its number of reservable sites, averaged over the years in that span when it took reservations (at least one full fiscal year), so a campground that joined Recreation.gov recently isn't undercounted. This lets a small campground that books up compare fairly with a big one. Reservable sites are the individual overnight sites Recreation.gov lists for the campground; group sites, cabins, lookouts, yurts, shelters, boat-in and day-use sites are left out, and so are their reservations. Campgrounds with fewer than 10 such sites, or whose site records don't match the bookings (for example shared walk-in sites), aren't ranked and are listed under the table.
Typical booking time. The median number of days between the day a reservation was made and the arrival date, across all FY2023–2025 reservations at that campground: half of campers booked at least that far ahead. Profiles turn the busiest month's weekend figure into calendar dates for the next season, worked out from today's date.
Estimated summer occupancy. The share of possible site-nights in summer (June–August) of 2023, 2024 and 2025 that had a reservation: reserved site-nights ÷ (reservable sites × nights in the season). It's an estimate. Cancellations aren't in the data, so it can run high; sites closed for repairs or late openings make it run low. Each site-night counts once. We leave it blank where the site count is unreliable or the result came out over 100%.
No "% available". These records show what was booked, not what was open on a given day, so we don't estimate availability from them. The "Sites open" tags come from our live availability check and only appear when it confirms open sites.
Bookings, not occupancy. Each count is a reservation made. Cancellations aren't in the data, so a booked site may later have opened up, and nights a campground was closed simply show no bookings.
COVID years are flagged. FY2020 and FY2021 were shaped by closures, capacity limits and a camping surge, so we mark them and don't use them for "then vs now" comparisons.
Lead time is the days between the booking date and the arrival date. Weekend means a Friday or Saturday arrival. First-come, pay-on-arrival sites are left out of lead times.
Only campgrounds that take reservations on Recreation.gov are included. State parks, private campgrounds and first-come campgrounds aren't in these numbers.