The 5 most in-demand federal campgrounds near Joshua Tree National Park
Ryan took about 252.1 reservations per site each year, the most of the 5 campgrounds we ranked. Half its campers booked ~4 weeks or more ahead, and its sites were an estimated 100% full in spring.
Ranked by reservations per reservable site per year (FY2023–2025), so a small campground that fills up counts as much as a big one. "Typical booking" is when half of campers had already reserved; spring occupancy is our estimate (see how we measured).
01 · Central park
Ryan Campground
A small campground among the rocks
Ryan Campground.Photo: NPS / Recreation.gov
31 tent and limited RV sites among the park's rock formations. No hookups or drinking water; Twentynine Palms is 17 miles away.
Half of March Friday and Saturday arrivals were reserved at least 36 days ahead, and a quarter at least 181 days ahead.
Its Recreation.gov records begin in FY2020; FY2023 was its busiest year, with 7,249 reservations.
~4 weeks out typical booking~100% full in spring (est.)252.1 reservations per site / yrRanked 1st of 5 · 30 reservable sites · 20,051 reservations FY2023–2025
124 tent and RV sites on flat sand between towering boulders. There are no hookups or drinking water; Twentynine Palms, 12 miles away, has basic supplies.
Half of March Friday and Saturday arrivals were reserved at least 44 days ahead, and a quarter at least 181 days ahead.
~4 weeks out typical booking~99% full in spring (est.)238.6 reservations per site / yrRanked 2nd of 5 · 119 reservable sites · 75,752 reservations FY2023–2025
Boulders and climbing routes on the park's north side
INDIAN COVE CAMPGROUND.Photo: Recreation.gov
101 individual sites and 13 tent-only group sites among the rock formations, close to many climbing routes. No hookups or drinking water in camp; water is two miles away at the ranger station.
Half of May Friday and Saturday arrivals were reserved at least 103 days ahead, and a quarter at least 161 days ahead.
Its earliest observed bookings came up to a year ahead, the longest window of this top five.
~4 weeks out typical booking~98% full in spring (est.)187.7 reservations per site / yrRanked 3rd of 5 · 97 reservable sites · 48,804 reservations FY2023–2025
In open Colorado Desert shrubland at the park's south end, far from town lights. 62 sites, with drinking water and flush toilets.
Half of May Friday and Saturday arrivals were reserved at least 55 days ahead, and a quarter at least 100 days ahead.
Bookings nearly tripled, from 3,010 in FY2018, its first year on Recreation.gov, to 8,965 in FY2025.
~3 weeks out typical booking~96% full in spring (est.)177.7 reservations per site / yrRanked 4th of 5 · 59 reservable sites · 28,199 reservations FY2023–2025
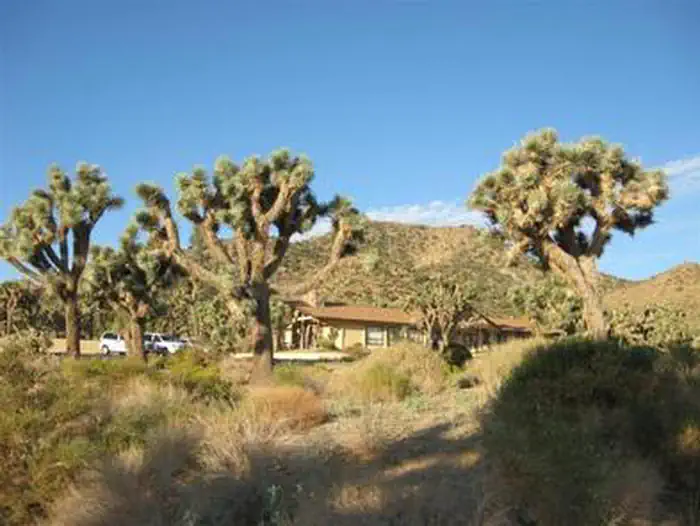
Among one of the park's thickest Joshua tree forests
BLACK ROCK CAMPGROUND RANGER STATION.Photo: NPS / Recreation.gov
On the park's northern edge, in one of its thickest stands of Joshua trees, and a popular rest stop for hikers.
Half of May Friday and Saturday arrivals were reserved at least 71 days ahead, and a quarter at least 106 days ahead.
~4 weeks out typical booking~96% full in spring (est.)170 reservations per site / yrRanked 5th of 5 · 94 reservable sites · 43,594 reservations FY2023–2025
All 5 campgrounds, ranked by reservations per site
Typical booking: median days between booking and arrival, FY2023–2025. Peak season, est. full: reserved site-nights ÷ (reservable sites × nights) in spring (March–April), 2023–2025; blank where we couldn't estimate it reliably. Ranking is reservations per reservable site per year, averaged over the FY2023–2025 years each campground took reservations (campgrounds that joined Recreation.gov recently are marked "Partial history"). Details in About this data.
Not ranked, because Recreation.gov doesn't list a reliable count of individual reservable sites (group, cabin or shared sites, fewer than 10 sites, or site records that don't match the bookings): Indian Cove Group (5,342 reservations), Sheep Pass Group (2,892 reservations), Cottonwood Group (1,069 reservations), Black Rock Equestrian Campground (383 reservations).
How Joshua Tree bookings have changed
Reservations peaked at about 91,000 in FY2023 and were about 80,000 in FY2025, still above the pre-2020 average of about 26,000 a year.
26,034 a year on average in FY2015–2019, 79,724 in FY2025, across all 9 campgrounds we studied. FY2020–21 were shaped by COVID closures and the camping surge.
FY15
FY16
FY17
FY18
FY19
49,522FY20COVID
80,467FY21COVID
FY22
FY23
FY24
79,724FY25
The set of campgrounds on Recreation.gov changed over these years (some, like Ryan, joined recently), so part of the change reflects which campgrounds were bookable there, not only how many people camped.
All values
FY2015: 16,118
FY2016: 18,926
FY2017: 21,594
FY2018: 34,032
FY2019: 39,502
FY2020: 49,522 (COVID year)
FY2021: 80,467 (COVID year)
FY2022: 88,122
FY2023: 91,030
FY2024: 85,993
FY2025: 79,724
Find a Joshua Tree campsite for your dates
Compare current openings and prices around Joshua Tree National Park.
Data: Recreation.gov reservations FY2015–2025. These are Recreation.gov's public reservation records (the RIDB historical reservation files), covering every federal campground in the area that took at least 300 reservations in FY2023–2025. Federal fiscal years run October to September, so FY2025 is October 2024 through September 2025.
Which campgrounds are included. Every federal campground inside Joshua Tree National Park or within 30 miles of its center point (straight-line distance) that takes reservations on Recreation.gov. Area / setting comes from each campground's Recreation.gov coordinates and managing agency; nearby towns are straight-line.
How we ranked. By reservations per reservable site per year: a campground's FY2023–2025 reservations divided by its number of reservable sites, averaged over the years in that span when it took reservations (at least one full fiscal year), so a campground that joined Recreation.gov recently isn't undercounted. This lets a small campground that books up compare fairly with a big one. Reservable sites are the individual overnight sites Recreation.gov lists for the campground; group sites, cabins, lookouts, yurts, shelters, boat-in and day-use sites are left out, and so are their reservations. Campgrounds with fewer than 10 such sites, or whose site records don't match the bookings (for example shared walk-in sites), aren't ranked and are listed under the table.
Typical booking time. The median number of days between the day a reservation was made and the arrival date, across all FY2023–2025 reservations at that campground: half of campers booked at least that far ahead. Profiles turn the busiest month's weekend figure into calendar dates for the next season, worked out from today's date.
Estimated spring occupancy. The share of possible site-nights in spring (March–April) of 2023, 2024 and 2025 that had a reservation: reserved site-nights ÷ (reservable sites × nights in the season). It's an estimate. Cancellations aren't in the data, so it can run high; sites closed for repairs or late openings make it run low. Each site-night counts once. We leave it blank where the site count is unreliable or the result came out over 100%.
No "% available". These records show what was booked, not what was open on a given day, so we don't estimate availability from them. The "Sites open" tags come from our live availability check and only appear when it confirms open sites.
Bookings, not occupancy. Each count is a reservation made. Cancellations aren't in the data, so a booked site may later have opened up, and nights a campground was closed simply show no bookings.
COVID years are flagged. FY2020 and FY2021 were shaped by closures, capacity limits and a camping surge, so we mark them and don't use them for "then vs now" comparisons.
Lead time is the days between the booking date and the arrival date. Weekend means a Friday or Saturday arrival. First-come, pay-on-arrival sites are left out of lead times.
Only campgrounds that take reservations on Recreation.gov are included. State parks, private campgrounds and first-come campgrounds aren't in these numbers.