The 15 most in-demand federal campgrounds near Asheville
Big Creek Campground (Great Smoky Mountains National Park) took about 107.3 reservations per site each year, the most of the 15 campgrounds we ranked. Half its campers booked ~5 weeks or more ahead, and its sites were an estimated 86% full in summer.
Ranked by reservations per reservable site per year (FY2023–2025), so a small campground that fills up counts as much as a big one. "Typical booking" is when half of campers had already reserved; summer occupancy is our estimate (see how we measured).
01
Big Creek Campground (Great Smoky Mountains National Park)
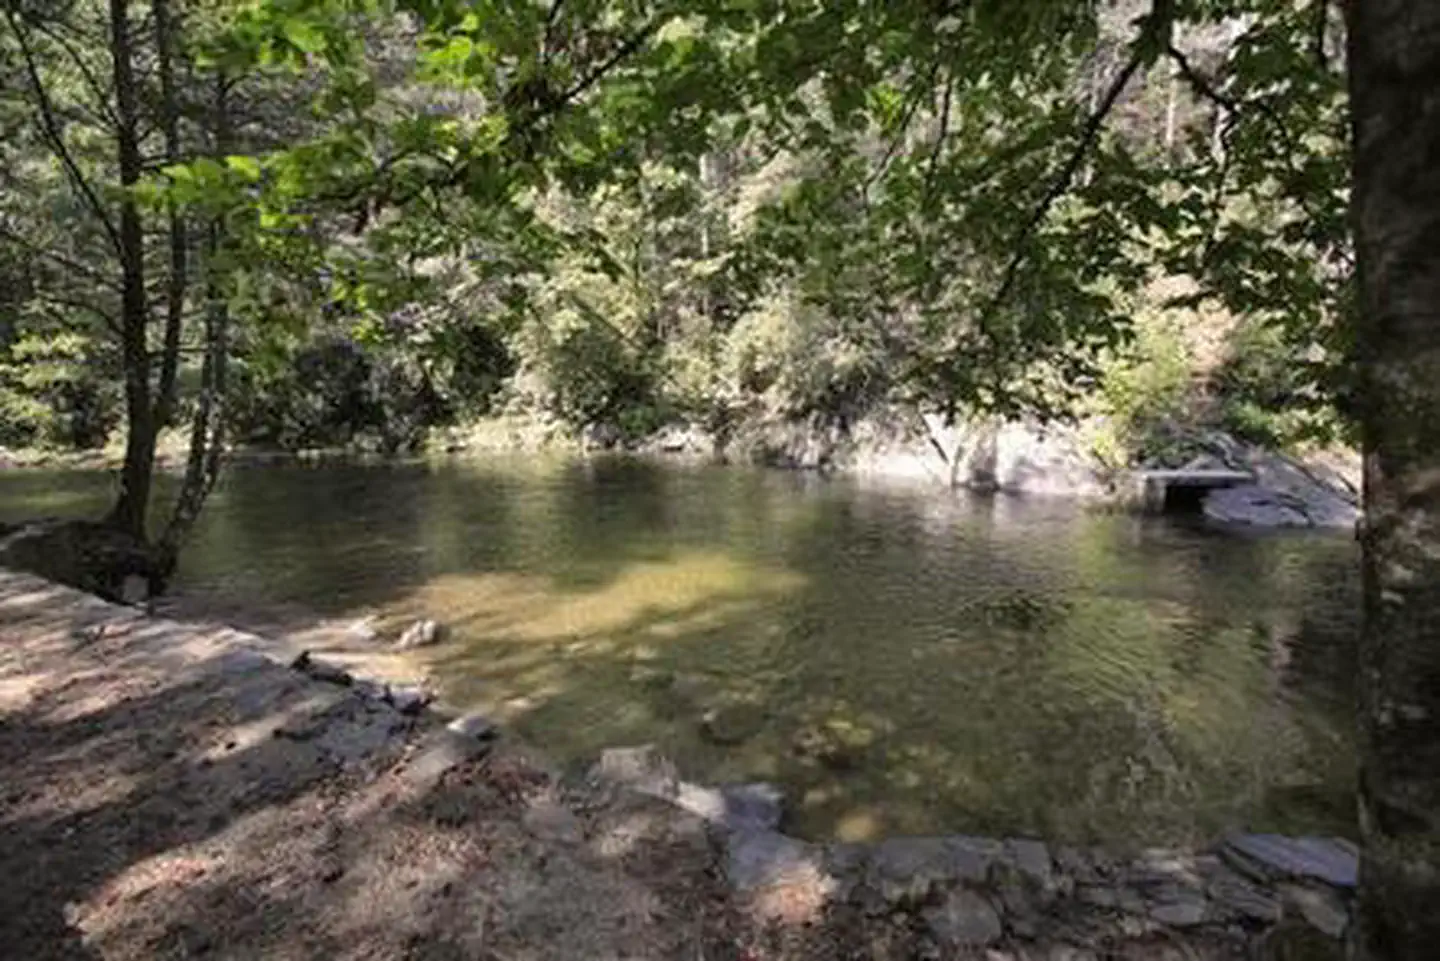
Rest Room.Photo: NPS / Recreation.gov
Great Smoky Mountains NP · 19 mi from Hot Springs
Half of August Friday and Saturday arrivals were reserved at least 50 days ahead, and a quarter at least 133 days ahead.
~5 weeks out typical booking~86% full in summer (est.)107.3 reservations per site / yrRanked 1st of 15 · 12 reservable sites · 3,598 reservations FY2023–2025
Several loops of shaded sites at 2,150 feet in Pisgah National Forest, with hiking trails, fishing spots and waterfalls nearby.
Half of May Friday and Saturday arrivals were reserved at least 80 days ahead, and a quarter at least 144 days ahead.
Its earliest observed bookings came nearly a year (358 days) ahead, the longest window of any campground near Asheville in this study.
~5 weeks out typical booking~88% full in summer (est.)104 reservations per site / yrRanked 2nd of 15 · 132 reservable sites · 38,967 reservations FY2023–2025
Lake Powhatan in the fall.Photo: Lake Powhatan / Recreation.gov
Four loops of shaded sites in heavy woods on Lake Powhatan, all within walking distance of the lake, with hot showers. Its glamping tents are booked separately.
Bookings peaked at 8,793 in FY2022 and have eased each year since, to 6,040 in FY2025.
~3 weeks out typical booking~74% full in summer (est.)103.6 reservations per site / yrRanked 3rd of 15 · 71 reservable sites · 21,129 reservations FY2023–2025
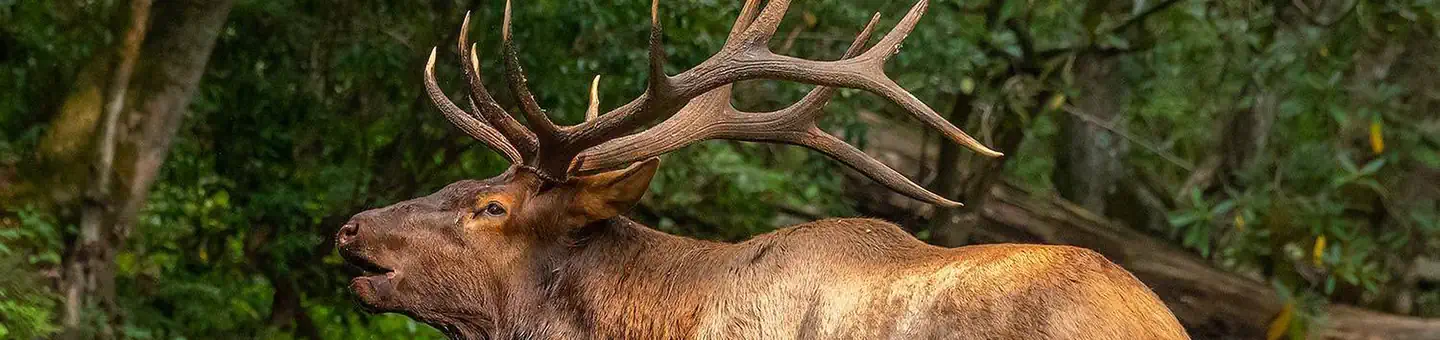
In the historic Cataloochee Valley, a relatively remote part of the Smokies by Cataloochee Creek; elk are common in spring and fall.
~6 weeks out typical booking~77% full in summer (est.)95.7 reservations per site / yrRanked 4th of 15 · 27 reservable sites · 7,253 reservations FY2023–2025
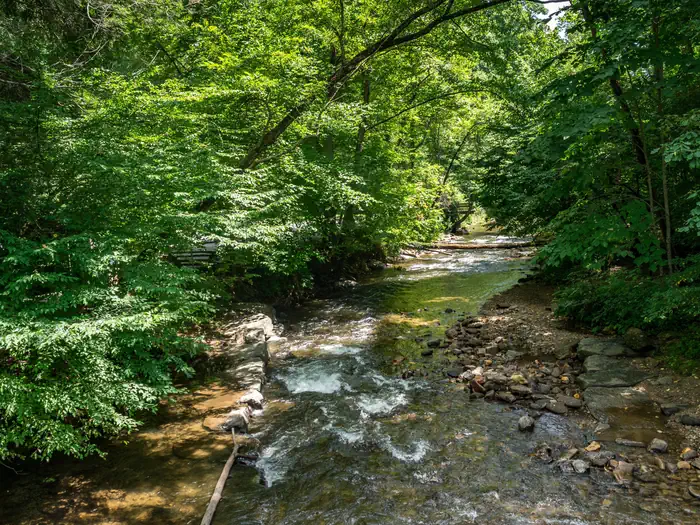
North Mills River.Photo: Ethan Calloway/Panthertown Investment Company / Recreation.gov
National Forests in North Carolina · 13 mi from Brevard
~4 weeks out typical booking~62% full in summer (est.)74.4 reservations per site / yrRanked 5th of 15 · 24 reservable sites · 5,334 reservations FY2023–2025
All 15 campgrounds, ranked by reservations per site
Typical booking: median days between booking and arrival, FY2023–2025. Peak season, est. full: reserved site-nights ÷ (reservable sites × nights) in summer (June–August), 2023–2025; blank where we couldn't estimate it reliably. Ranking is reservations per reservable site per year, averaged over the FY2023–2025 years each campground took reservations (campgrounds that joined Recreation.gov recently are marked "Partial history"). Details in About this data.
Reservations peaked at about 58,000 in FY2021 and were about 37,000 in FY2025, still above the pre-2020 average of about 20,000 a year.
20,329 a year on average in FY2015–2019, 36,525 in FY2025, across all 21 campgrounds we studied. FY2020–21 were shaped by COVID closures and the camping surge.
FY15
FY16
FY17
FY18
FY19
35,002FY20COVID
57,747FY21COVID
FY22
FY23
FY24
36,525FY25
The set of campgrounds on Recreation.gov changed over these years (some, like Paint Creek and Wolf Ford Horse Camp, joined recently), so part of the change reflects which campgrounds were bookable there, not only how many people camped.
All values
FY2015: 13,085
FY2016: 16,498
FY2017: 19,966
FY2018: 26,534
FY2019: 25,563
FY2020: 35,002 (COVID year)
FY2021: 57,747 (COVID year)
FY2022: 52,759
FY2023: 48,612
FY2024: 46,904
FY2025: 36,525
Find a Asheville campsite for your dates
Compare current openings and prices around Asheville.
Data: Recreation.gov reservations FY2015–2025. These are Recreation.gov's public reservation records (the RIDB historical reservation files), covering every federal campground in the area that took at least 300 reservations in FY2023–2025. Federal fiscal years run October to September, so FY2025 is October 2024 through September 2025.
Which campgrounds are included. Every federal campground within 40 miles of downtown Asheville, including the Blue Ridge Parkway and Pisgah National Forest (straight-line distance) that takes reservations on Recreation.gov. Area / setting comes from each campground's Recreation.gov coordinates and managing agency; nearby towns are straight-line.
How we ranked. By reservations per reservable site per year: a campground's FY2023–2025 reservations divided by its number of reservable sites, averaged over the years in that span when it took reservations (at least one full fiscal year), so a campground that joined Recreation.gov recently isn't undercounted. This lets a small campground that books up compare fairly with a big one. Reservable sites are the individual overnight sites Recreation.gov lists for the campground; group sites, cabins, lookouts, yurts, shelters, boat-in and day-use sites are left out, and so are their reservations. Campgrounds with fewer than 10 such sites, or whose site records don't match the bookings (for example shared walk-in sites), aren't ranked and are listed under the table.
Typical booking time. The median number of days between the day a reservation was made and the arrival date, across all FY2023–2025 reservations at that campground: half of campers booked at least that far ahead. Profiles turn the busiest month's weekend figure into calendar dates for the next season, worked out from today's date.
Estimated summer occupancy. The share of possible site-nights in summer (June–August) of 2023, 2024 and 2025 that had a reservation: reserved site-nights ÷ (reservable sites × nights in the season). It's an estimate. Cancellations aren't in the data, so it can run high; sites closed for repairs or late openings make it run low. Each site-night counts once. We leave it blank where the site count is unreliable or the result came out over 100%.
No "% available". These records show what was booked, not what was open on a given day, so we don't estimate availability from them. The "Sites open" tags come from our live availability check and only appear when it confirms open sites.
Bookings, not occupancy. Each count is a reservation made. Cancellations aren't in the data, so a booked site may later have opened up, and nights a campground was closed simply show no bookings.
COVID years are flagged. FY2020 and FY2021 were shaped by closures, capacity limits and a camping surge, so we mark them and don't use them for "then vs now" comparisons.
Lead time is the days between the booking date and the arrival date. Weekend means a Friday or Saturday arrival. First-come, pay-on-arrival sites are left out of lead times.
Only campgrounds that take reservations on Recreation.gov are included. State parks, private campgrounds and first-come campgrounds aren't in these numbers.